Results

Three accounts, three different questions.

One was a test with a yes or no answer, where you can see exactly what happened when the ads went on and when they came off. One is the same promotion run two ways a month apart. And one is the account we own, where we put $2.87m of our own money through Meta in nine months.

Case — Rinsedco, clothing and lifestyle

$4,713 of ad spend. $26,236 through the store.

Rinsedco had plateaued. They had tried running Meta themselves and got nothing back for it, and they were not sure the hoodie line had a future at all. The brief was not growth. It was one question: does this product work on paid, or are we about to invest in something the market does not want?

Most agencies would have quoted a three month engagement. The honest answer needed a fraction of that.

What we did

Four campaigns, structured to answer different parts of the question rather than chase a single number. A broad Advantage+ campaign to see whether the product found an audience unaided. A bid cap campaign to find what the market would actually pay to acquire a customer. A catalog-free variant to test whether the creative or the feed was doing the work.

Campaigns went live on 16 July, ran to completion, then stopped. No mid-flight panic. The point of a test is the reading.

$4,713
Total ad spend
$26,236
Store revenue, up 189%
166
Orders, up 202%
$3,132
Best day, from $170

Ads on, ads off

The store had been doing $200 to $400 on an average day. The day the campaigns went live it did $3,131.99 — against $169.99 on the comparable day a month earlier. When the campaigns stopped, it settled back to $200 to $400.
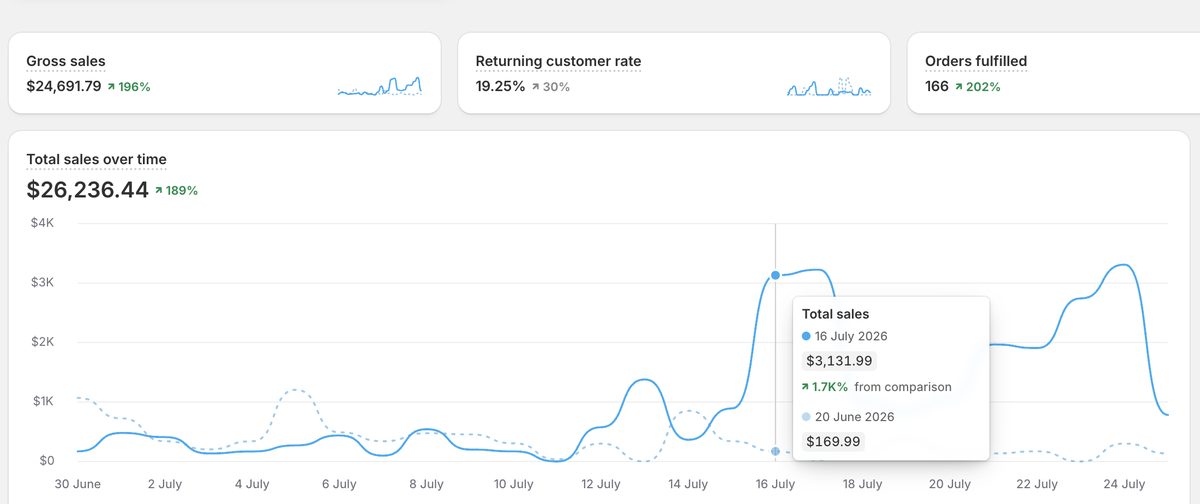
Shopify sales over time during the campaign trial
Rinsedco’s Shopify, 30 June – 25 July against the month before. Campaigns live from 16 July.

Why this one matters more than a ROAS number

Most case studies show a line going up and ask you to take the cause on trust. This one has a control. Same store, same products, same customers — the only variable is whether we were running.

It is also counted in Shopify rather than in what Meta claims credit for. Meta credited itself with roughly $18,000 of that revenue. The store took $26,236. The second number is the one that ends up in a bank account.

The client got a decision rather than a dashboard: a product line with proven demand and a known acquisition cost, for less than a month of most agency retainers.

Figures taken directly from the ad account and the store, shared with the client’s permission.
Case — a promotion-led store

The same promotion, run two ways, one month apart.

This client runs a monthly promotion that builds to a final weekend. We ran the May campaign. They ran June themselves, and changed the package pricing away from what we had recommended.

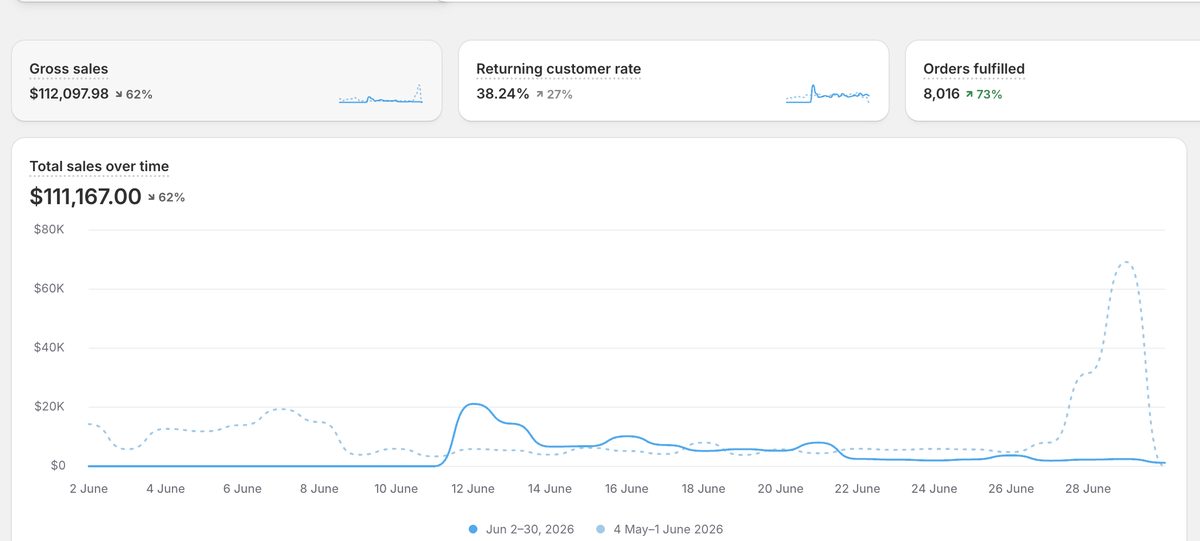
Both months are on the chart below. May is the dashed line, June is solid. Look at the last weekend of each.

$352,216
May, with us — up 17%
$111,167
June, without us — down 62%
~$65k
Our final promo weekend
Flat
Theirs
Two months of store sales compared, with and without our campaigns
June solid, May dashed. The promotion peak at the end of May does not repeat in June.

The part that cost the most was not the ads

June actually took more orders than May — 8,016 against 7,847. Revenue still fell by nearly two thirds, because the average order dropped from about $45 to about $14.

That is not an advertising problem. That is pricing. The packages were repriced away from what we had recommended, the volume held up, and the margin went with it.

Why we ask about pricing before budget

This is the clearest example we have of the argument we make on every first call. You can run the same offer to the same audience with the same spend and lose most of the revenue on a pricing decision made in an afternoon.

We give that advice free, before anyone signs anything, because getting it wrong costs more than the retainer ever will.

Client anonymised. Figures taken directly from their store, not from platform-attributed reporting.

Case — our own account

Nine months. $2.87m of our own money through Meta.

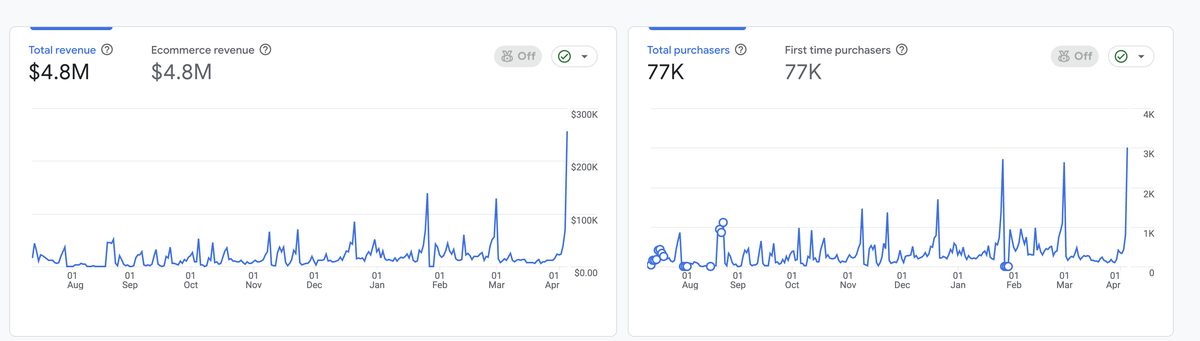
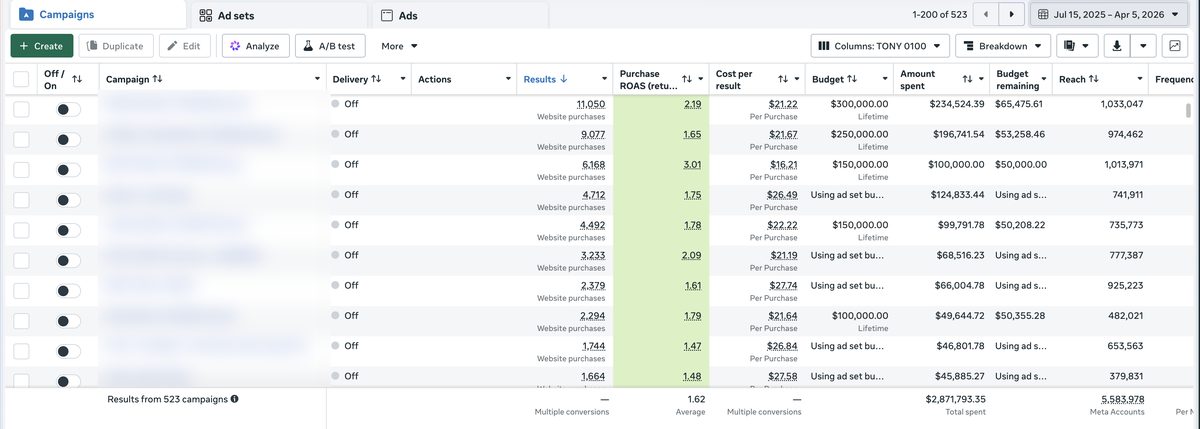
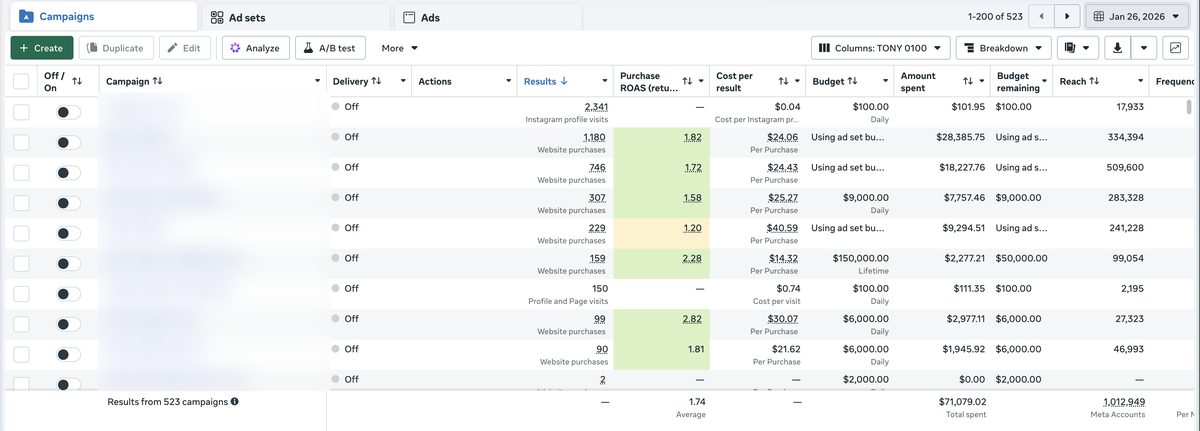
This is the account every structure we put on a client account was paid for in. Between 15 July and 5 April we spent $2,871,793 of our own money across 523 campaigns, reached 5.5 million accounts, and brought 77,000 customers through the door.

No client to invoice if it went badly. When something did not work, it came out of our own pocket, which is a different kind of education from spending someone else’s budget.

$2.87m
Our own ad spend, 9 months
$4.8m
Revenue over the same window
77,000
Customers
523
Campaigns
Revenue across nine months
Nine months of revenue, 15 July to 5 April.
The ad account across the same nine months
The same window in the ad account. Campaign names blurred.

One campaign from inside that, in detail

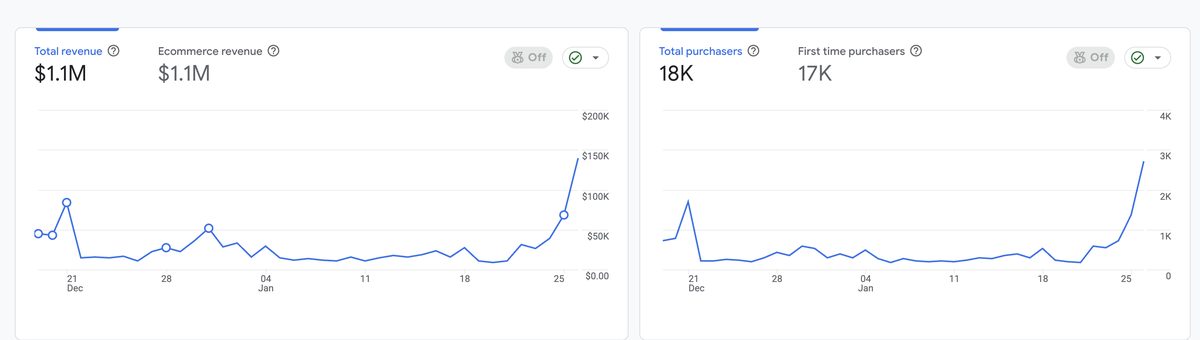
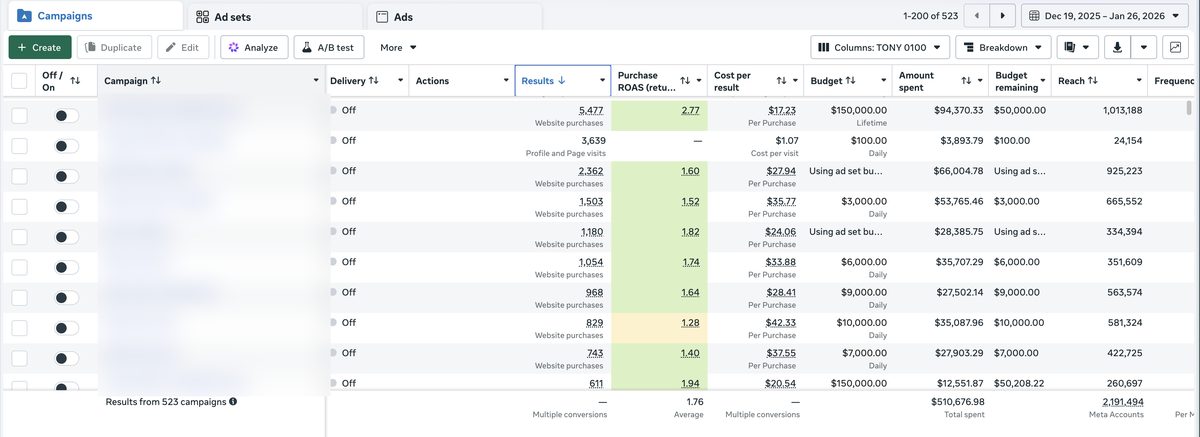
19 December to 26 January. $510,677 of spend, $1.1m in revenue.

$1.1m
Revenue, five weeks
$510,677
Ad spend
18,000
Purchasers, 17,000 of them new
$139,000
Final day
Revenue over the campaign, 19 December to 26 January
Revenue across the five week campaign, building to the final day.
The ad account across the campaign period
The same period in the ad account. Campaign names blurred.

The last day did $139,000

On 26 January the campaign took $139,000 on $71,079 of ad spend. The fixed costs of the campaign were already covered by that point, so nearly all of that was margin on a single day.

That day did not happen by accident. It is what a five week campaign is built toward — the offer, the deadline, and the creative volume all pointed at it.

The ad account on the final day of the campaign
26 January on its own: $71,079 of spend against $139,000 of revenue.

Where the money actually went

Across the whole campaign: $1.1m in revenue, $510,677 in ad spend, and $200,000 in fixed campaign costs. Roughly $389,000 left before the rest of the costs of running it.

We publish that breakdown because it is the conversation we have with clients. Return on ad spend is not the number. What is left after everything is the number.

One more thing worth noticing

Meta reported a blended 1.76 return on that campaign. Measured in analytics against actual revenue, it was closer to 2.15. Same campaign, two different pictures.

That gap is why we build reporting on your store rather than on what the platform claims credit for — and it is why we ask for your margins before we ask for your budget.

Read these numbers in context

Published benchmarks put ecommerce around 2.87x on Meta, with a median closer to 2.04x. The returns above sit under that, and there is a reason worth understanding.

This is a promotion-led business with repeat purchase, not a single-order ecommerce store. First-order return on ad spend understates it, because a large share of revenue comes from customers who buy again and never touch a paid ad the second time. The figure that matters here is what the campaign cleared after every cost, not the multiple the platform reports.

It is the same argument we make about your account. Compare a number to your own break-even, not to someone else’s industry average — work yours out here.

Start a conversation